
Important facts about the distribution of possible sample means are summarized in the Central Limit Theorem, which can be stated as follows:
If a random sample of N cases is drawn from a population with mean μ and standard deviation σ, then the sampling distribution of the mean (the distribution of all possible means for samples of size N)
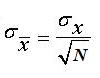
2) has a standard deviation (also called “standard error”) equal to the population standard deviation, σx, divided by the square root of the sample size, N:
3) and the shape of the sampling distribution of the mean approaches normal as N increases.
The Central Limit Theorem states what the mean and the standard deviation of the sampling distribution of the mean will be for any given sample size, and it also states that the shape of this sampling distribution approaches normal as the sample size increases, whatever the shape of the population distribution.
This information allows us to determine the likely accuracy of a sample mean, especially if the sampling distribution of the mean is approximately normal.
If the population distribution is normal, then the sampling distribution of the mean will be normal for any sample size N (even N=1). If a population distribution is not normal, but it has a bump in the middle and no extreme scores and no strong skew, then a sample of even modest size (e.g., N=30) will have a sampling distribution of the mean that is very close to normal. However, if the population distribution is far from normal (e.g., extreme outliers or strong skew), then to produce a sampling distribution of the mean that is close to normal it may be necessary to draw a very large sample (e.g., N=500 or more).
Important note: You should not assume that the sampling distribution of the mean is normal without considering the shape of the population distribution and the size of your sample.
![]()