
Recall that the population mean for the height of Ourtown women is 5 feet, 4 inches (64 inches), the population standard deviation is 3 inches, and the distribution is normal. Now, try ordering the likelihood of the following four instances from the most likely to least likely. It may be helpful to draw pictures.
- You select one woman from Ourtown at random and she is 5 feet, 4 inches (64 inches) tall to the nearest inch.
- You select one woman from Ourtown at random and she is 6 feet, 1 inch (73 inches) tall to the nearest inch.
- You select a random sample of 10 women from Ourtown, and the mean of their heights, to the nearest inch, is 5 feet, 4 inches.
- You select a random sample of 10 women from Ourtown, and the mean of their heights, to the nearest inch, is 6 feet, 1 inch.
Which of the following is the correct order? Why? Consider the reasons before you check the answer.
1, 3, 2, 4
Sorry, this answer is incorrect!
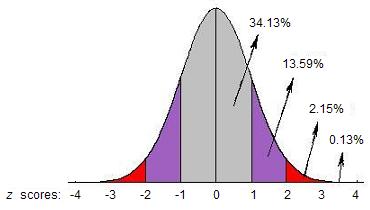
Look at the figure below. As the normal curve shows, selecting a single woman who is about 64 inches is fairly likely. However, there is another choice that is more likely. Consider the variance of the sampling distribution of the mean.
3, 1, 2, 4
Excellent answer! The population mean of 5 feet, 4 inches is the most likely height for a randomly selected individual woman or for a sample mean. The mean for a sample with N = 10 has much smaller variability than an individual observation (N = 1), so the mean for a sample of N = 10 is more likely to be within an inch of the population mean.
On the other hand, it is extremely unlikely that you will select a sample of 10 women with a mean of 6 feet, 1 inch. In order to get such a large mean, your sample would include many unusually tall women. Since the likelihood is low of selecting even one woman this tall, it is very unlikely you will find many unusually tall women in your sample. If any women in the sample were of average height or below, you would need women that were even taller than 6 feet, 1 inch in your sample to obtain a sample mean of 6 feet, 1 inch. This being the case, it would be very unlikely to select a random sample with such an extreme mean. Selecting a single case this tall would be more likely.
1, 3, 4, 2
Sorry, this answer is incorrect!
Look at the figure below. As the normal curve shows, selecting a random sample of 10 women from Ourtown with 6 feet, 1 inch as the mean of their heights is very unlikely because there are very few women of these heights. Also, if any women in the sample were of average height or shorter, you would need other women even taller than 6 feet, 1 inch to obtain a sample mean of 6 feet, 1 inch. Selecting a single case this tall would be more likely.
3, 1, 4, 2
Sorry, this answer is incorrect!
You are correct that we are more likely to observe scores near the mean than farther from the mean. However, we also need to consider the difference in variability of individual scores and sample means.
![]()