
In most situations, there is one optimal cut-point, though the exact value can be greatly influenced by base rates and utility considerations, in addition to test means and standard deviations.
In Example 2, the population base rates are equal for the two groups (50:50), the standard deviation is 5 in both groups, and the mean is 10 points greater in Group 2 (60 vs. 50). The utility of classifying a Group 1 case as Group 1 is +1, and the utility is -1 for each type of classification error (classifying a Group 1 case as Group 2 or classifying a Group 2 case as Group 1). However, the utility of correctly identifying a Group 2 case as a Group 2 case is relatively very high, with a utility estimate of 10. The values are entered into the blue cells.
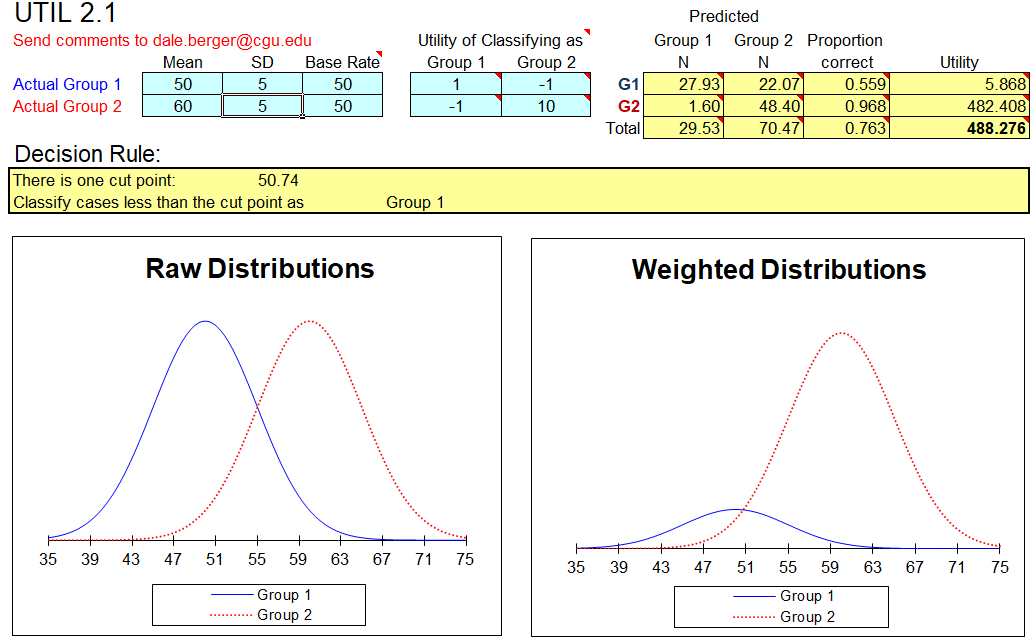
The decision rule is to classify cases with a test score less than 50.74 as Group 1 and cases with a larger test score as Group 2. The expected classification results would be 27.93 of the 50 Group 1 cases correctly classified as Group 1 (55.9% correct), and 48.40 of the 50 Group 2 cases correctly classified as Group 2 (96.8% correct), for an overall correct classification rate of 76.3%. Total Utility is 488.276.
Notice that the relatively greater utility of classifying a Group 2 case as Group 2 causes more cases to be classified as Group 2. The shift toward classifying ambiguous cases as Group 2 leads to correct classification of almost all Group 2 cases (96.8%), but at the cost of only 55.9% correct classifications for the Group 1 cases.
![]()