 |
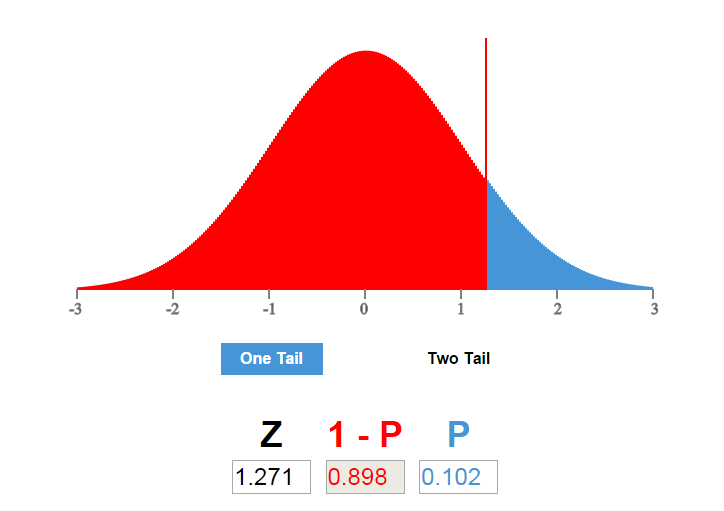
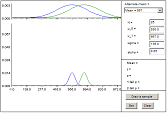
- p-z Converter
- This applet converts probability values to z values and vice versa. The simple version converts only right-tail p and z values. The graphic version allows the user to input left-tail p, raw scores, and the mean and standard deviation of the group of interest.
|
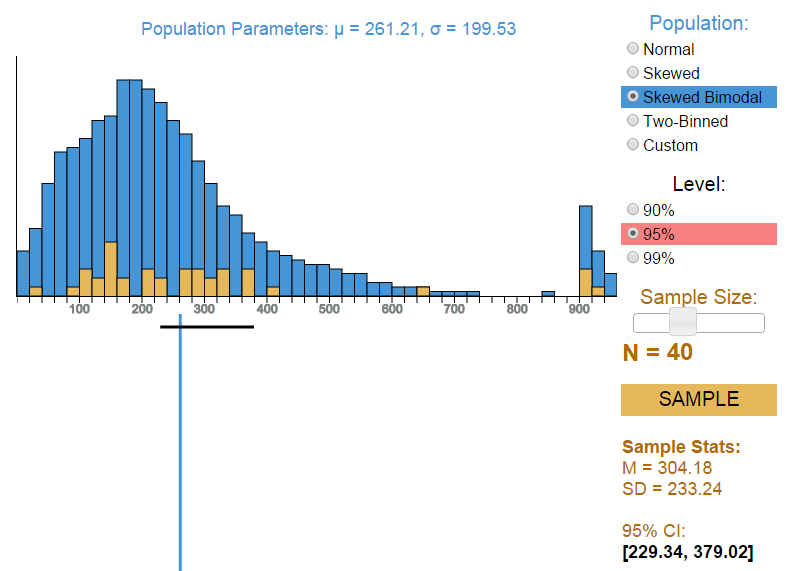 |
- Confidence Interval Creation
- This applet can be used to demonstrate how the population distribution and sample size influence confidence intervals.
- – Confidence Interval Creation demonstration guide
|
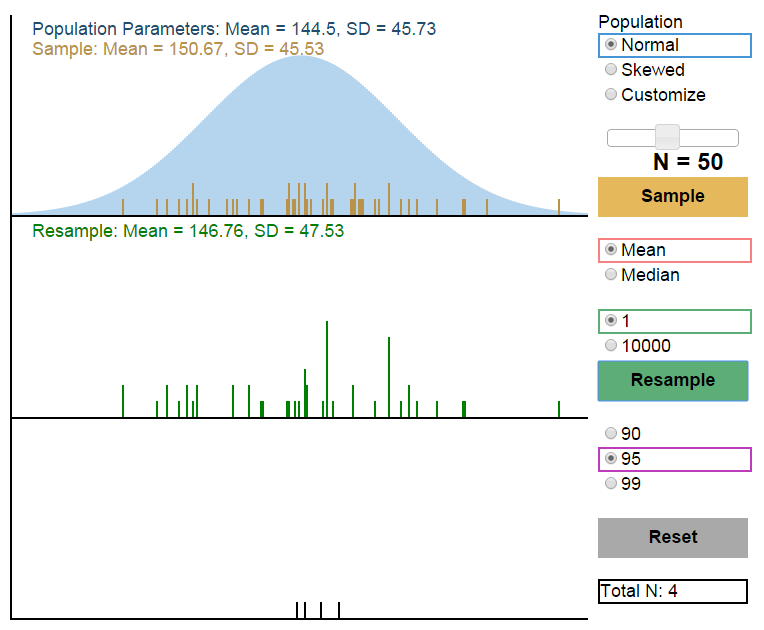 |
- Bootstrapping
- This applet can be used to help visualize the resampling method of bootstrapping. “Resamples” from an original sample can be taken one at a time, or 10,000 at once, ultimately providing a 95% confidence interval for the population mean or median.
|
 |
- Sampling Distribution of the Mean [no longer supported]
- This applet teaches fundamental properties of sampling distributions of means such as accuracy of sample means, probability, and effects of sample size.
|
 |
- Hypothesis Testing Applet [no longer supported]
- This applet serves to introduce the logic of hypothesis testing using z-scores.
|
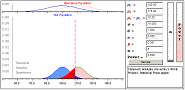 |
- Statistical Power [no longer supported]
- This applet introduces the concept of power and the relationship between power and effect size, alpha, and sample size.
- – Power Applet demonstration guide
|
 |
- Confidence Interval Overlap [no longer supported]
- This applet demonstrates how t-test p values are related to amount of overlap of confidence intervals.
- – Confidence Interval Overlap demonstration guide
|
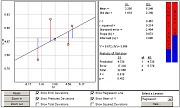 |
- Correlation and Regression [no longer supported]
- This applet demonstrates how the sum of squared deviations is affected by the fit of the regression line to data points.
|
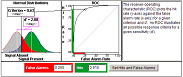 |
- Signal Detection Theory [no longer supported]
- SDT is a statistical theory of decision making which summarizes a person’s ability to discriminate between different classes of items based upon their correct decisions (Hits) versus their Errors (False Alarams). The applet also plots the Receiver-Operating Characteristics.
|
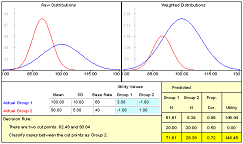 |
- Classification, Utility, and Decision Making [use the Excel download of UTIL]
- An applet which assists in determining group membership based upon test performance, utility of correct and incorrect classification, and population base rates.
|
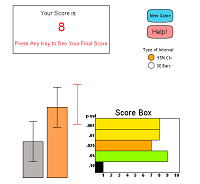 |
- Confidence Interval Game [no longer supported but see the video demonstration]
- This applet was designed to provide a fun method to learn about p values. Challenge yourself and see how well your estimates ma
|
