
In the last section, we calculated that there is about a 13% probability of obtaining a sample mean of 550 or greater when randomly drawing a sample of 5 individuals from the population of VAST-test takers. When the sample size is 25, this probability decreases to a mere 0.6%.
The figure below depicts these p-values (in dark blue) in the sampling distribution of means for the different sample sizes. In which sampling distribution does obtaining a sample mean of 550 have a smaller p-value?
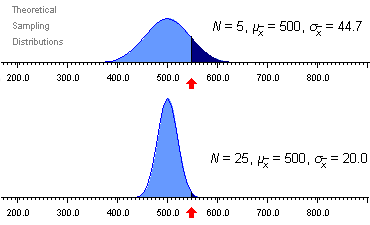
Indeed, our computations showed that it is highly unlikely (p = .006) to find a sample mean for 25 individuals to be as large as 550 if the true population mean was 500. We could interpret this information as evidence that this sample of 25 individuals was drawn from a different (or alternative) population with a mean greater than 500.
With a sample size of 5, we would have less support for such a conclusion because the probability of obtaining a sample mean as great as 550 from the population of VAST test-takers who have not gone through the training program is p = .131, not nearly as unlikely as if this mean was obtained from a sample of 25.
What implication does this have for the conclusions we draw regarding the claims of VAST training programs? How do these p-values help us make decisions about whether a sample came from a population with a treatment effect?
![]()