
Concerning the null hypothesis Ho that the ACE training graduates do not have higher VAST scores than non-graduates, there are two possible decisions we can make based upon our observed sample mean: “reject Ho” or “fail to reject Ho.”
Question: If there is no treatment effect, which decision regarding the null hypothesis is correct and which is in error?
|
Actual Situation: |
||
| There is no effect | ||
|
Decision: |
Reject the null | Type 1 Error |
| Fail to reject the null | Correct Decision |
When there is no treatment effect but we reject the null hypothesis and conclude that there is an effect, we are making an error. This is called a Type 1 error, falsely concluding that there is an effect, by rejecting the null, when there is no effect (top purple cell). On the other hand, if we fail to reject the null hypothesis, our conclusion correctly matches the actual situation (bottom purple cell).
Alpha, Type 1 Error, and Critical Values
Whether or not we reject the null hypothesis is determined by whether the observed sample mean exceeds a critical value. The critical value is defined on the sampling distribution for means of samples of size N drawn from the null distribution, where the probability of obtaining a sample mean as large as or larger than the critical value is equal to a pre-defined alpha, α.
We can compute a critical value in four easy steps:
- Identify the p-value for the critical value. Here the p-value is .05 on the upper tail.
- Convert the p-value to a z-score. Here the p–z converter tells us that a z-score of 1.645 cuts off .05 on the upper tail.
- Multiply the z-score by the standard error to find the distance the critical value is from the mean.
- Add this distance to the mean to find the numerical value of the critical value.
In the figure below, the sampling distributions of the mean are shown for N = 5 (top) and N = 25 (bottom) and critical values (573.56 and 532.9 respectively, represented by dotted red lines) are both set at α = .05. The light blue regions indicate the parts of the sampling distribution where the sample mean is below the critical value, thus leading to the decision to fail to reject the null hypothesis. The dark blue regions show areas of rejection. Thus, when there is no treatment effect (and we are sampling from the null population), the light blue regions represent the probability of making the correct decision, and the dark blue regions represent the probability of making a Type 1 error, that is α.
- Alpha, α, is the probability of making a Type 1 error when Ho is true. This value is specified by the researcher before looking at the data.
- In the two sampling distributions below, the dark blue regions both represent 5% of the distribution, corresponding to the value of α = .05 that was specified.
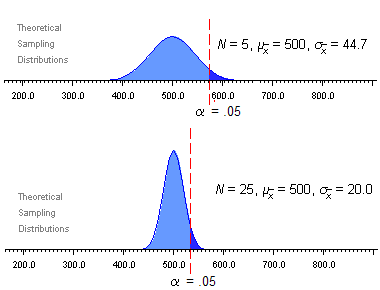
Notice that with a bigger sample size, the critical value is closer to the null mean because of reduced sample mean variability. Thus, the size of the sample mean needed to reject the null hypothesis, in our example, is smaller when the the sample size is larger.
We can now update the decision matrix by labeling the cells and inserting their probabilities when the actual situation is that there is no treatment effect:
|
Actual Situation: |
||
| Null is true (no effect) |
||
|
Decision: |
Reject the null (effect supported) |
Type 1 Error (probability = α) |
| Fail to reject the null (effect not supported) |
Correct Decision (probability = 1 – α) |
![]()