
A friend of yours has developed a scale to measure Life Satisfaction. She has already tested this scale on the population of American adults, and found that it has a normal distribution with a mean of 500. She plans to measure Life Satisfaction for various groups of people and has asked you to help assess how accurate her sample means are likely to be depending upon the size of her samples. This exercise is designed to help you prepare for her questions.
Let’s get started!
Question 1. Find the probability for a single score. What is the probability that a randomly selected American adult has a Life Satisfaction score within 30 points of the population mean?
Does it matter that the population scores are normally distributed?
Yes! Because the Life Satisfaction Scale is normally distributed in the population, z scores will also be normally distributed. This is extremely important to the probability calculations we will be making throughout this tutorial. If the distribution of interest is far from being normal, these calculations would not be valid!
A good way to make an approximation here is to look at the distribution (Figure 1.) and estimate what percent of the total area under the curve falls between 470 and 530. Remember, the total area is 1.0 (or 100%).
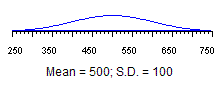
Figure 1. Population distribution of the Life Satisfaction Scale
Make your best estimate:
The probability of a score from 470 to 530 is about .
Solve for the exact answer and enter the exact score
Show Hint: How to think about this
Recall that z scores reflect how much a score deviates from the mean. To convert a score x into a z score, subtract that x from the mean and then divide by the standard deviation:
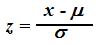
Since the mean of Life Satisfaction scores is 500 and the standard deviation is 100, a Life Satisfaction score of 600 equals a z score calculated as follows:
(600 – 500)/100 = 100/100 = 1, or one standard deviation above the mean
Given that the range of scores is covered by Life Satisfaction scores between 470 and 530, calculate the z scores of each and look up their probabilities.
Show Hint: Z scores
A score of 470 corresponds to a z score of (470-500)/100 = -30/100 = -0.30
A score of 530 corresponds to +0.30.
Remember, you are looking for the probability of obtaining z scores between -0.30 and +0.30. Don’t be thrown off by the right-tail p value given by the p-z converter, which indicates the probability of obtaining a score which is greater than the specified z score.
Show answer
The answer is .236, or about 24%.
Here’s how we arrived at it:
Since the distribution of the population is normal, we first calculate the standardized z score corresponding to 530. To do this we recall that the population has a mean of 500 and a standard deviation of 100.
z = (x – mean)/sd = (530 – 500)/100 = 30/100 = 0.3
Then we calculate the z score corresponding to 470.
z = (x – mean)/sd = (470-500)/100 = -30/100 = -.30.
Then we use the z table, or the p-z calculator, to find that the probability that a randomly selected score would have a z value greater than 0.3.
The probability of a score with a z value greater than 0.3 is 0.382.
The probability of a score has a z value less than -.3 is also 0.382.
Thus, the probability of observing a z score between -0.3 and +.3, and we calculate it as follows:
1.000 – (382 + .382) = 1.000 – .764 = .236, or about 24%.
![]()