
When standard deviations on the test are different for the two groups, it is possible that there are two cut-points, where cases in both tails of the test distribution are classified into one group while cases toward the middle are classified into the other group.
In Example 3, the group means are equal at 60 and the population base rates are equivalent (50:50), but the standard deviation for Group 1 is twice as large as for Group 2 (20 vs. 10). The researcher determined that correct classification of Group 2 individuals was twice as important as correct classification of Group 1 individuals (utility values of +2 and +1, respectively). The researcher weighted incorrect classification of Group 1 and Group 2 as equivalent and not very serious (both -1).
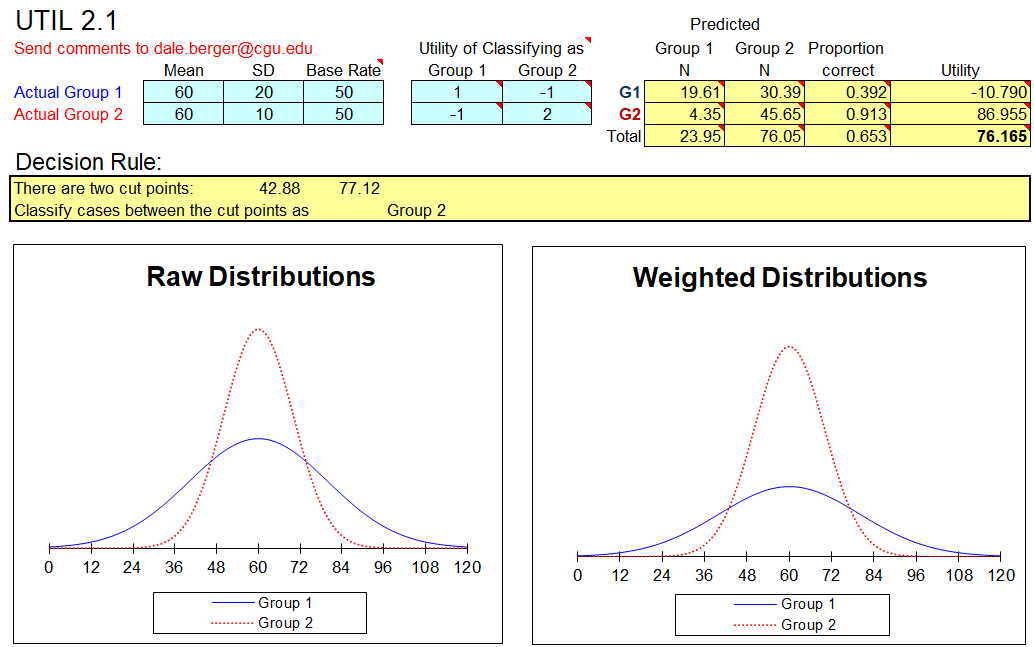
There are two cut-points such that scores greater than 77.12 and less than 42.88 should be classified as Group 1; otherwise Group 2. Using these criteria, 39.2% of the Group 1 cases and 91.3% of the Group 2 cases are expected to be correctly classified. Because of the relatively small variance for Group 2, cases that are very near the mean for Group 2 are highly likely to be from Group 2, while cases farther from the mean in either direction are much less likely to be from Group 2. Thus, overall classification accuracy is 65.3% even though the two population means are identical.
Last Modified: 1/26/2018
![]()