
In some situations, maximum utility is attained by classifying all cases into one group. If the benefit (positive utility) is very high for correctly classifying a Group 1 case into Group 1, or if the cost (negative utility) is very high for classifying a Group 1 case into Group 2, maximum utility may be attained by classifying all cases into Group 1. Also, if members of Group 2 are extremely rare in the population, extremely strong evidence would be needed to justify classification of a case into Group 2.
In Example 1, Group 1(shown in solid blue) has a larger mean than Group 2 (shown in dotted red), 10 vs. 0, respectively. Group 1 also has greater variability of scores in the population (SD = 10 vs. 5), and a much greater base rate (100:10). Assume that the utility is +1 for either correct decision and -1 for either incorrect decision.
Enter this information about the test distributions, base rates, and utility into the light blue boxes. The results are shown in the yellow boxes. (click on the figure to expand)
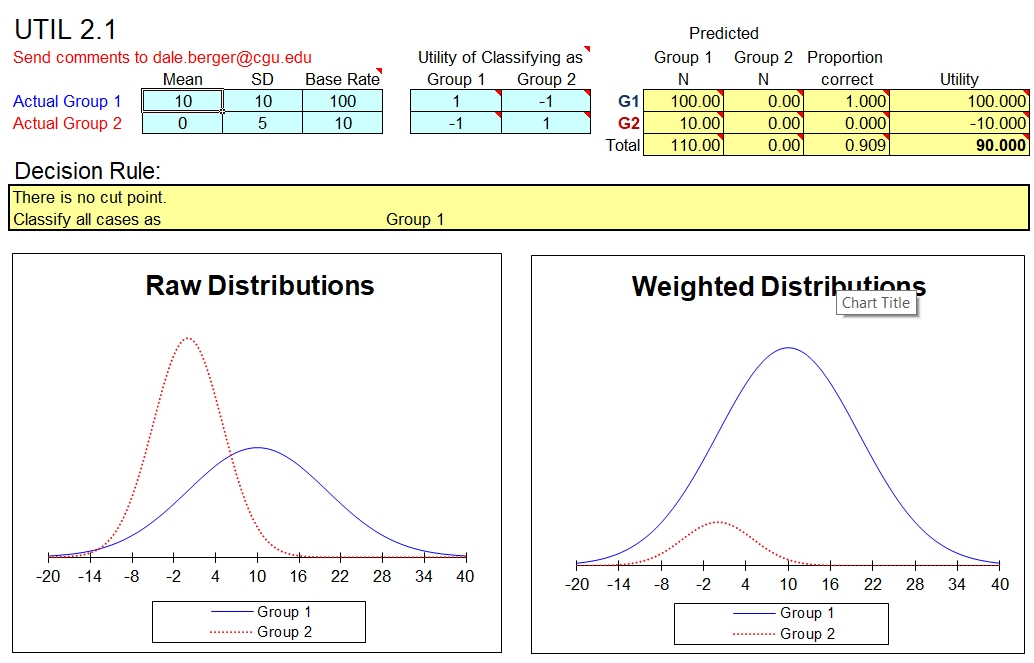
In this example, the Decision Rule is to classify all cases as Group 1. The yellow boxes under Predicted show that this rule yields 100% correct classification for all 100 Group 1 cases but 0% correct for all 10 Group 2 cases. Thus, classification is correct for 100 cases out of the total of 110 cases, or 100/110 = .909 = 91% correct overall. The total Utility is 90, from 100 correct decisions (+100) and 10 incorrect decisions (-10).
The Weighted Distributions graph provides a visual representation of the situation. Because Group 1 cases are so much more likely in the population (100 out of 110 cases are Group 1), the weighted distribution for Group 1 is greater than the weighted distribution for Group 2 at all test values.
![]()